BLOGS

Causal Inference: The Question of
'Why' in Machine Learning and Business Analytics

By Abhinav Thorat, Research Engineer at Sony Research India

29th March 2023

Human beings are curious by nature, and it is our curiosity that made us what we are today. But the fundamental question that drives the curiosity is the question ‘Why?’.

Why we do somethings, why things happen and what could have happened so on and more interestingly why do we ponder on the question of why?.

What is Causal Inference?

Causal Inference is essentially the method of inferring causes from data. If we have enough observational data, we can infer causes from that data, but it is not that simple and gets complicated as we go in-depth. But why must we go away from statistical analysis where we have enough methodologies for understanding correlation? The reason is that Correlation is not Causation

Why Correlation ≠ Causation?

Causality is about interventions and taking actions which can influence the end goal. Standard statistics is all about correlation, which is good to an extent, but correlation can often lead to wrong assumptions.
To Explain this with simple example, consider that a Data Analyst is asked to predict shark attacks on a sunny beach in California. He/she collects all the data and finds that sales of Ice-creams are directly correlated with shark attacks, i.e., when Ice-cream sales go up, shark attacks tend to increase as well.
However, this does not mean that ice-cream sales cause shark attacks or vice-versa. The third variable at play is temperature.  As the temperature increases, sales of ice-cream and incidents of shark attacks record an increase, but that does not define a causal relationship between these two independent variables and is termed as spurious correlation. The variables which affect intervention and outcomes are called as confounders and they are first roadblock in establishing a cause-effect relationship.

Understanding Confounders & Counterfactual Regression

In statistics, a confounder is a variable that influences both the dependent variable and independent variable, causing a spurious association. For example, individuals earning high salaries might be well educated but all wealthy businessmen might not be highly educated. Here the confounder is intelligence, which influences education (Treatment) and wages (Outcome).
The axiom diagram below is Directed Acyclic Graph or Graphical Causal Model in Causal inference. Graphical models are the language of Causality. Independence and conditional independence are central to causal inference and causal graphical models are a way to represent how causality works in terms of what causes what.

Directed Acyclic Graph

Since we have the ability to intervene in the data-driven world, we can carry out counterfactual regression where we can estimate the effect of treatment (Intervention) on an outcome by comparing what would have happened if same group had not been treated.

This brings us to Potential outcomes framework. To wrap our heads around this, we will talk in terms of potential outcomes. They are potential because they didn’t happen. Instead, they denote what would have happened in the case some treatment was taken. We sometimes call the potential outcome that happened, factual, and the one that didn’t happen, counterfactual.

As for the notation, we use an additional subscript:

Y_i0 is the potential outcome for unit(i) without the treatment.

Y_i1 is the potential outcome for the same unit(i) with the treatment.

Causal Inference in Machine Learning and Business Analytics

Average treatment effect
Randomized control trials are gold standard for collecting data for machine learning implementations based on causal inference. Scientists and engineers utilize predictive capabilities of machine learning to do counterfactual regression which eventually helps to calculate average treatment effect, given as ATE=E[Y(1)-Y(0)] In Machine learning, we have flexibility of training multiple models with algorithms and neural networks to measure ATE by counterfactual prediction. ATE is considered as the most important metric in causal inference because it gives a clear indication of which treatment should be considered and finalized for the expected outcome.
Machine Learning for Causal inference.
Some established methods for ATE are Inverse propensity weighing, matching, doubly robust estimations, propensity score matching along with these there are various meta-learning algorithms can be utilised based on treatment imbalance such as S-Learner, T-Learner etc. In research problems we experiment on algorithms that can perform counterfactual regression for multiple treatment rather than binary treatment   and for continuous treatment such as treatment dosage.
Causal Inference in Business Analytics
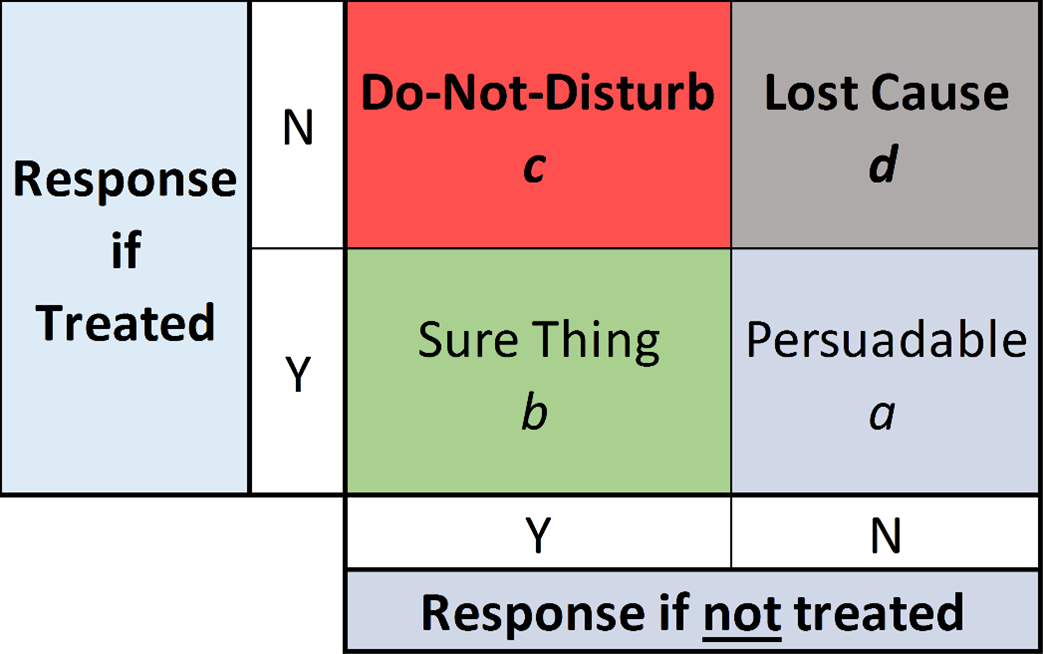
One of the most common use-case of causal inference in business analytics is Uplift Modelling

Uplift modelling

In Uplift modelling we can use counterfactual prediction to check if a user will respond if treated or not. This allows us to identify persuadable users to do selective targeting and cost of acquisition is utilised in such way that it improves overall returns.
In a nutshell, causal inference can help us determine whether A causes B, or if it’s just a coincidence. It’s like scientific magic trick that allows us to go beyond the curtains of correlation and see what’s really going on. It is a key for solving the mystery of cause and effect. If you want to go beyond traditional machine learning and add causal context to your decision making based on data, causal inference is the way!
References: Causal Inference in statistics: an overview by Judea Pearl, 2009

Causal Inference from Machine Learning perspective by Brady Neal, 2020

Skip to content